Metrics In, AI-Powered Answers Out

SEE how your
franchise locations
stack up.

Catch the locations quietly slipping — labor creep, sliding reviews, missed audits — before they cost you. One score per location. Every metric behind it.

Get Started

Built for multi-unit franchisors and their franchisees — from 10 locations to 500+.

Franchise Overview

148 Locations

170
#1
Sarasota, FL 170
#2
Charleston, SC 161
#3
Wilmington, NC 105
#4
Virginia Beach, VA 76

JAN — DEC 2025 · SYSTEM AVG SEEScore

Top Metric

Net Sales

+13.4% ↑

Every location scored, every day Dozens of third-party integration options Enterprise SSO available Full API access to your data Your data, exportable any time

Straight From the Product

See the whole network —
and your place in it.

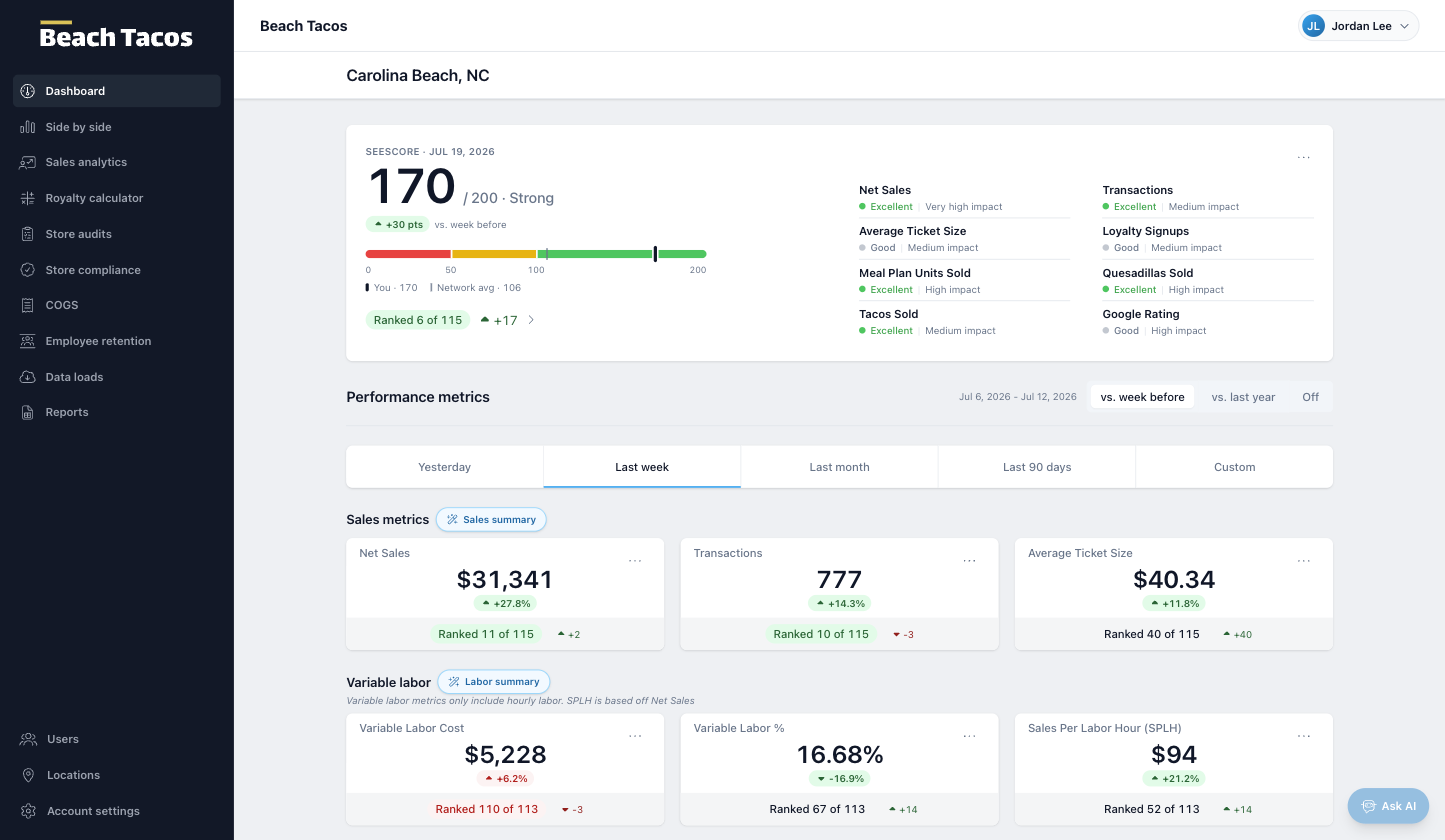
Franchisees get their location's SEEScore and the metrics driving it. Franchisors get every location ranked on any metric. The same live data and the same clarity for both — on every device.

app.franchisesee.com/dashboard
FranchiseSEE franchisee dashboard showing a location's SEEScore, impact-weighted metrics, and network rankings
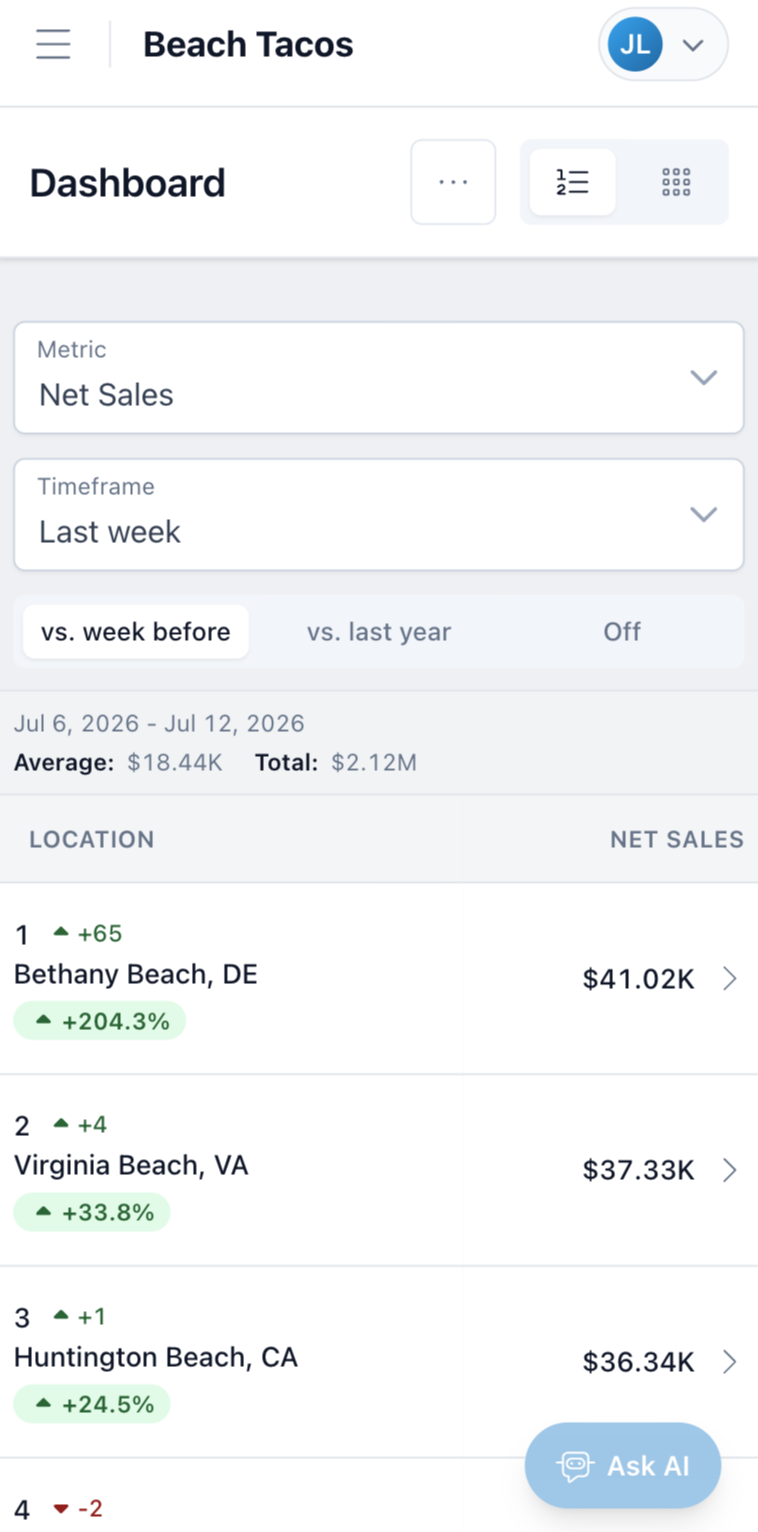
FranchiseSEE franchisor mobile view showing the network Net Sales leaderboard with rank changes

Every metric ranked across the network

Score drivers, impact-weighted at a glance

Ask AI from any screen

Core Capabilities

Everything you need to
run a healthier franchise.

SEEScore™ Engine

A single "health score" for every location — like a credit score for franchisees. Use our defaults or customize weighting to build your perfect ranking formula.

Multiple Data Metrics

Automatically ingest sales, labor costs, cost of goods, online reputation, field audits, compliance, employee retention, training stats, and custom first-party data.

Open API Integrations

Connect to your POS, backoffice, accounting, Google and more. Our open API plugs into your existing tech stack for seamless data ingestion.

Mobile Leaderboards

Monitor franchise rankings from any device. Mobile and tablet friendly so you stay informed on the go.

Data Export

Export sales-level data via CSV or push it through our API into other tools in your stack. Your data, your way.

Field Audit Import

Input field audit scores manually, via CSV upload, or through API. Because audits are critical to true franchise health visibility.

How It Works

Three steps to
total visibility.

1

Connect Your Data

Plug in your POS, reputation sites, back-office tools, and any custom data via our API or manual import.

2

Configure Your SEEScore

Weight each metric from "Very High Impact" to "No Impact" to build the ranking formula that fits your brand.

3

Monitor & Act

Watch real-time leaderboards, spot underperformers, celebrate top locations, and export data to drive decisions.

The SEEScore™

One number.
Complete clarity.

Think of it as a credit score for your franchise locations. The SEEScore aggregates dozens of metrics into a single, weighted health indicator so you can instantly see who's thriving and who needs support.

Fully customizable metric weighting

Separate dashboards for franchisors & franchisees

Per-location pricing — scales with your growth

Curious about the math? See how the score is calculated →

Try it — weight what matters to your brand

#1 · Sarasota, FL

Net Sales Very High
Labor Efficiency Low
Customer Rating High
Audit Score Moderate

Sample data — drag the weights, tap a location. The real thing scores every location in your network, on the metrics you choose.

Powered by AI

From raw metrics to
real answers.

FranchiseSEE doesn't just collect your data — it understands it. Chat with your numbers in real time, connect your own AI tools to everything you've aggregated, and read plain-language insights the moment they matter.

Chat with your data, live

Ask FranchiseSEE anything in plain English and get an answer in real time. The built-in assistant queries your live reporting data as you chat — never guessing — and streams back clear, conversational responses you can keep digging into.

Ask, then follow up — natural, multi-turn conversations across locations, metrics, and periods

Grounded in real numbers — pulls live figures on every turn, so it never invents or estimates

Answers that draw themselves — streamed replies with inline tables and charts, not walls of text

Bring your own AI

Prefer your own tools? Point any external chat client — Claude, or anything that speaks MCP — straight at FranchiseSEE through our MCP server. Your team asks questions in plain English against every metric, location, and period you've aggregated, on a single, governed source of truth.

Prompt-driven queries across all of your aggregated franchise data

Power custom dashboards with leaderboards, trendlines, and metric queries

Works with Claude and any MCP-compatible AI harness

Insights, written for you

Every day, FranchiseSEE reads your numbers and writes them up in plain language — no dashboards to decode. Anomaly alerts, SEEScore driver breakdowns, sales forecasts, and ranked recommendations arrive automatically, right where your team already works.

What happened — daily sales and labor summaries in clear, readable narratives

Why it happened — diagnostics that pinpoint what moved a metric

What's coming — forecasts and early warnings for at-risk locations

What to do — prioritized, dollar-quantified recommendations
The AI assistant is rolling out to early customers now — ask for a preview in your demo.

FAQ

Common questions.

Is your system for franchisors or franchisees? +
Both! We offer dedicated dashboards for each role with a specific focus on metrics — giving you the overall franchise picture or granular store-level detail.
What is the SEEScore? +
The SEEScore is an overall "health" score — similar to a credit score — that shows how a franchisee is performing relative to the rest of the franchise system.
What data points make up the SEEScore? +
It pulls from sales data, labor costs, online reputation sources like Google, field audit scores, compliance efforts, employee retention, training stats, and any custom metrics you define.
How is the SEEScore determined? +
Using weighted metrics — from "Very High Impact" to "No Impact" — our algorithm creates an overall health score per location based on your custom weighting preferences.
Can you connect to our current systems? +
Yes — we pull from POS systems, online reputation platforms, back-office tools, and many more. Our open API makes integration straightforward.
How does pricing work? +
FranchiseSEE is priced per location, determined by concept type, data metric requirements, and other factors. Request a demo and we'll put together a quote tailored to your brand.

Ready to see your
franchise clearly?

Tell us a little about your franchise and we'll reach out to schedule a personalized demo.

Prefer email? info@franchisesee.com Existing customer? support@franchisesee.com

Your data stays yours — encrypted in transit and at rest, exportable any time, never shared.